You can visualise key statistics calculated for your sessions on the Charts view. This is particularly helpful to analyse long term trends in your training.
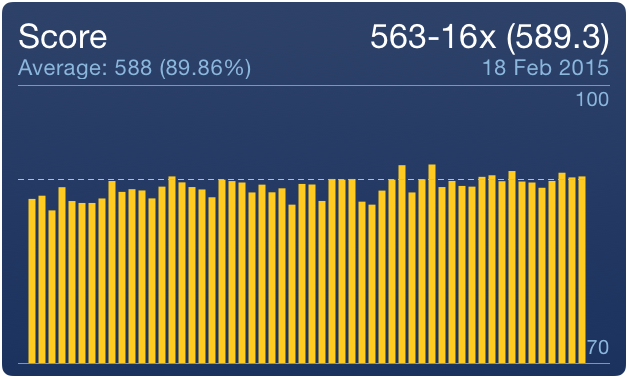
The Score bar chart shows your score as a percentage of scored points out of possible score. This allows you to compare sessions with different number of shots. The chart also shows average score calculated from the last 10 sessions which is visualised as a dashed line. Obviously the higher score the better.
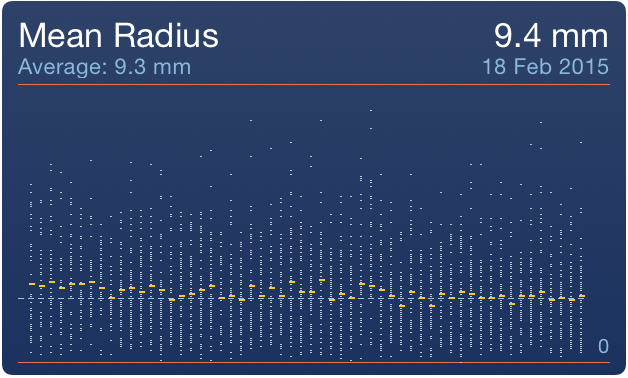
The most important aspect of your training is to ensure that your group is tight. The 'Mean Radius' chart allows you to compare group size between your sessions. TargetScan first calculates for each session the Mean Point of Impact (MPI) and then measures the distance of each shot from the MPI. This distance is then visualised as a white dot for each shot on the chart. The average distance of each shot from MPI (a.k.a Mean Radius) is visualised as a yellow dash. You can also see how many outliers are in each session. The smaller is the Mean Radius the better. An ideal group would have mean radius equal to zero.
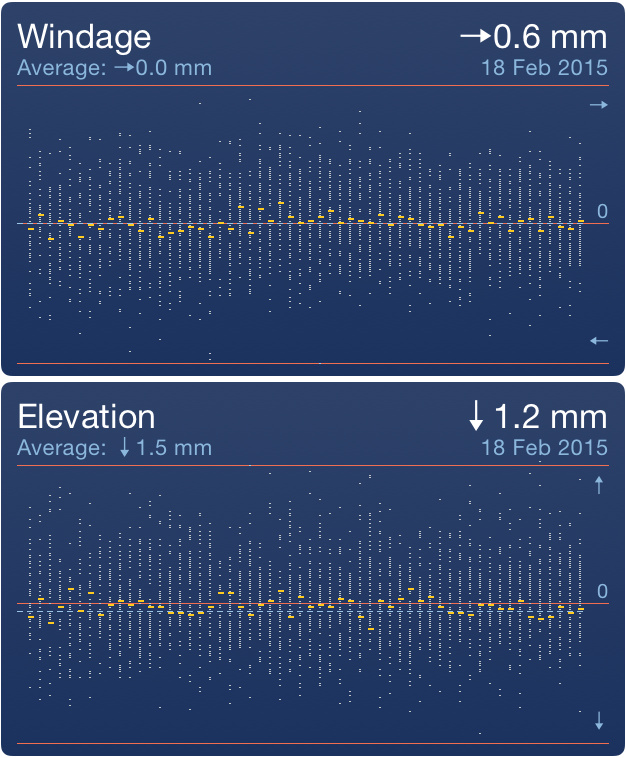
In order to maximise your score it is important to make sure that the Mean Point of Impact (MPI) is as close as possible to the Point of Aim (POA). The Windage and Elevation charts allow you to verify that you are not making a systematic error. Each shot is visualised as a small white dot on the chart and the mean value is visualised as a yellow dash. The closer to the centre the better. The interpretation of the chart depends on your strategy regarding the sights adjustment. If you rather keep the sights in one position then you can check on the chart whether it would be beneficial to to an adjustment. If you adjust you sights frequently, even during a single session the then the chart might be helpful to check whether you are doing it without a systematic error. As with the previous charts the average is calculated from last 10 sessions.
In order to access this view simply tap on the 'Charts' icon in the Sessions view.